TL;DR:
- Monitoring cloud performance is essential for preventing blind operation, avoiding silent cost increases, and ensuring SLAs.
- It improves reliability by enabling faster incident detection, root-cause analysis, and business-aligned service level objectives.
Monitoring cloud performance is not optional for any organization running production workloads on AWS, Azure, or Google Cloud. It is the mechanism that protects revenue, keeps SLAs intact, and prevents cloud bills from silently inflating. Without it, you are operating blind: incidents surface through customer complaints rather than alerts, and wasted spend compounds undetected for months. The sections below cover the key metrics that matter, the business case for monitoring investment, practical implementation steps, common pitfalls, and when to bring in a specialist.
- Monitoring catches performance regressions before users do, cutting mean time to detect and resolve (MTTD/MTTR).
- Cloud monitoring is the systematic collection, correlation, and alerting on telemetry across distributed infrastructure — the nervous system of your platform.
- Google Cloud Well-Architected guidance recommends continuously re-evaluating performance requirements as workloads change.
- Microsoft Azure guidance recommends representing latency as percentiles and building health models to reduce alert noise.
Table of Contents
- What does cloud performance monitoring actually measure?
- Why monitoring directly improves reliability and business outcomes
- How monitoring enables cost optimization and measurable ROI
- What tools and approaches should you consider?
- How to implement effective cloud performance monitoring
- Common pitfalls that undermine monitoring programs
- When should you bring in a monitoring specialist?
- Key Takeaways
- The case for monitoring-first migrations
- IT-Magic handles the full monitoring and migration lifecycle
- Useful sources and further reading
- FAQ
What does cloud performance monitoring actually measure?
Cloud performance monitoring collects telemetry across five pillars: metrics (time-series numbers like CPU and latency), logs (structured event records), traces (request paths across services), events (state changes and deployments), and synthetic/RUM checks (simulated and real-user transactions). Each pillar answers a different question. Metrics tell you what changed; traces tell you where in the call chain; logs tell you why.
The metrics that matter most are the ones users feel directly.
| Metric | Why it matters | SLI/SLO target type | Collection source |
|---|---|---|---|
| Request latency (p50/p95/p99) | Reveals tail-latency outliers averages hide | Percentile threshold | APM agent, service mesh |
| Error rate | Signals broken functionality or misconfigured services | Success-rate percentage | Application logs, APM |
| Throughput (req/s) | Baseline for capacity and autoscaling decisions | Min/max band | Load balancer, API gateway |
| CPU / memory utilization | Identifies over- and under-provisioning | Utilization ceiling | Cloud-native metrics |
| Queue depth / replication lag | Flags backpressure and data-pipeline delays | Max depth | Message broker, DB replica |
| Cold-start time | Affects serverless user experience | p95 ceiling | FaaS platform metrics |
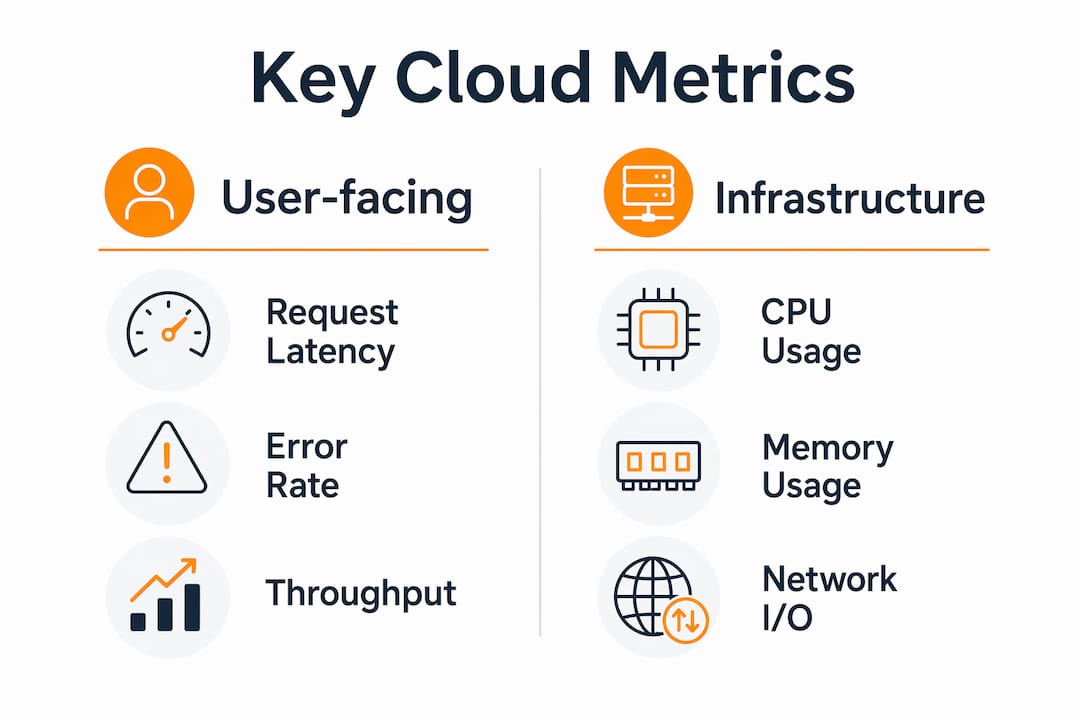
Averages hide bad experiences — a p99 latency spike that affects 1% of requests can represent thousands of users per hour. Percentiles expose what averages bury.
Pro Tip: Define SLIs around user-facing outcomes (request success rate, checkout latency) rather than raw infrastructure thresholds. A CPU alert at 80% means nothing without knowing whether users noticed.
Why monitoring directly improves reliability and business outcomes
Faster detection is the most direct benefit. Correlating traces, logs, and metrics cuts MTTD and MTTR because engineers see the full picture in one place rather than pivoting between disconnected tools. A team that previously spent two hours tracing a payment failure across five microservices can reduce that to minutes with distributed tracing in place.

SLI/SLO frameworks turn monitoring into a deployment accelerator. When you define an error budget — say, 99.9% availability allows roughly 44 minutes of downtime per month — teams can deploy confidently as long as the budget holds. That discipline replaces the instinct to freeze deployments after any incident.
Key business outcomes from well-implemented monitoring:
- Reduced customer churn: catching a checkout regression before a peak traffic window protects conversion rates directly.
- Faster incident resolution: health models that aggregate multiple signals into one alert prevent alert storms and point engineers to the right service immediately.
- Compliance and SLA evidence: continuous telemetry provides the audit trail regulators and enterprise customers increasingly require. Financial services workloads, for example, face strict uptime and audit requirements — monitoring is the foundation for meeting them.
- Safer deployments: deploy metadata correlated with performance signals surfaces regressions within minutes of a release, not days.
Unified observability that correlates infrastructure and application performance is the practical path to faster root-cause analysis and business-aligned SLOs.
How monitoring enables cost optimization and measurable ROI
Cloud waste is largely invisible without monitoring. Idle instances, misconfigured autoscaling triggers, runaway batch jobs, and oversized storage tiers accumulate silently until the invoice arrives. Monitoring spend per resource tag and correlating it with actual utilization is the mechanism that makes rightsizing decisions defensible rather than guesswork.
The ROI calculation is straightforward: establish a cost baseline per service before any change, apply the optimization (downsize an instance family, fix an autoscaling floor, archive cold storage), then measure the delta over 30 days. Teams that add cost-aware tagging to every resource before instrumenting monitoring consistently find the clearest attribution.
Telemetry has its own cost. Retention periods, ingestion rates, and query patterns all drive monitoring platform spend. A team that ingests every debug log at full retention can easily spend more on observability than the waste it uncovers. Design your telemetry strategy with tiered retention: short-term for alerting, longer-term for trend analysis and compliance.
A realistic scenario: an eCommerce team discovers through CPU and request-rate metrics that several EC2 instances in a staging environment run continuously with low utilization. Scheduling them off during non-business hours eliminates that spend with no SLO impact. The monitoring investment that surfaced the finding pays for itself in the first billing cycle.
What tools and approaches should you consider?
Four broad categories cover most teams’ needs:
Cloud-native observability (AWS CloudWatch, Azure Monitor, Google Cloud Operations Suite) is the lowest-friction starting point. Every service emits metrics automatically. The tradeoff is limited cross-cloud correlation and vendor lock-in on query languages.
Vendor platforms (Datadog, Dynatrace, New Relic) add unified dashboards, ML-based anomaly detection, and cross-cloud correlation. Operational overhead is low; licensing cost is higher.
Open-source stacks (Prometheus + Grafana, Jaeger, OpenTelemetry Collector) give maximum control and no per-seat licensing. They require more engineering effort to operate reliably.
Unified observability layers — often built on OpenTelemetry instrumentation feeding a centralized store — are the architecture pattern most teams converge on at scale. OpenTelemetry provides vendor-neutral instrumentation for traces, metrics, and logs, so you can swap backends without re-instrumenting.
| Approach | Best for | Overhead | Key trade-off |
|---|---|---|---|
| Cloud-native tools | Single-cloud, early-stage | Low | Limited cross-service correlation |
| Vendor platform | Multi-cloud, fast time-to-value | Medium | Licensing cost at scale |
| Open-source stack | Cost-sensitive, engineering-heavy teams | High | Operational burden |
| OpenTelemetry + central store | Scale, vendor flexibility | Medium | Initial instrumentation effort |
Design monitoring to survive partial outages: use redundant exporters, keep short-term metric retention local to alerting systems, and avoid a single point of failure in your telemetry pipeline.
How to implement effective cloud performance monitoring
- Inventory critical user journeys. Map the transactions that directly affect revenue or SLA compliance. Instrument those first.
- Define SLIs tied to user impact. Request success rate and p99 latency are better SLIs than CPU utilization for most services.
- Set SLOs and error budgets. An SLO with high availability targets gives you a concrete error budget to manage deployments against.
- Establish baselines over 30 days. Collect p50/p95/p99 latency and error rates across typical traffic patterns before setting alert thresholds.
- Tag every resource for cost attribution. Environment, service, team, and cost-center tags are the minimum. The AWS migration checklist covers tagging as a pre-migration requirement for exactly this reason.
- Build health models. Aggregate related signals into a single alert state rather than firing individual threshold alerts.
- Define retention and query policy. Short-term (15 days) for alerting; 90+ days for trend analysis; compliance-driven for audit logs.
- Create runbook templates for the five most common alert types before going live.
Google Cloud recommends treating monitoring as a continuous engineering practice tied to architecture reviews, not a one-time setup task.
Pro Tip: Run your first alert thresholds loose during the baseline period. Tighten them after 30 days of real traffic data. Static thresholds set on day one almost always produce alert fatigue.
Common pitfalls that undermine monitoring programs
The most expensive mistake is building monitoring around infrastructure metrics instead of user-facing SLIs. A dashboard full of CPU and memory charts looks thorough but tells you nothing about whether users are succeeding.
Alert fatigue is the silent killer of monitoring programs. When every threshold breach fires an alert, on-call engineers start ignoring pages. The fix is not more alerts — it is fewer, better ones tied to SLO breaches and health-model states rather than raw metric values.
Other red flags to watch for:
- A sudden rise in low-level alerts with no corresponding user impact report (threshold misconfiguration).
- Untagged spend growth that cannot be attributed to any service or team.
- Deploy-linked performance regressions that take more than 30 minutes to detect (missing deploy metadata in telemetry).
- Slow root-cause analysis on multi-service incidents (missing distributed tracing).
Telemetry cost is also frequently overlooked. Ingesting everything at maximum resolution and retaining it indefinitely can make monitoring itself a significant line item.
When should you bring in a monitoring specialist?
Engage external specialists when any of these conditions apply:
- Monitoring gaps are blocking a migration. You cannot validate post-migration performance without instrumentation in place first. IT-Magic’s cloud performance optimization guide covers exactly this dependency.
- You cannot map costs to services. If your cloud bill is a single undifferentiated number, no internal optimization effort will be reliable.
- Repeat incidents persist after internal fixes. This usually signals missing distributed tracing or incomplete SLI coverage.
What a specialist engagement delivers: an instrumentation audit, SLI/SLO design for your critical services, tagging and cost-mapping implementation, autoscaling tuning, runbook automation, and knowledge transfer. A typical engagement runs audit (week 1–2), pilot on one critical service (weeks 3–6), then rollout and optimization (weeks 7–12). Success criteria to request upfront: a measurable reduction in p99 latency, a defined cost-reduction percentage per service, and a documented SLO for each critical journey.
Key Takeaways
Monitoring cloud performance is the foundation for cost control, reliability, and deployment velocity — teams that skip it pay in incidents, wasted spend, and slow recovery.
| Point | Details |
|---|---|
| Prioritize user-facing SLIs | Measure request success rate and p99 latency before any infrastructure metric. |
| Baselines before thresholds | Run 30 days of data collection before locking in alert thresholds to avoid false positives. |
| Tag resources for cost attribution | Environment, service, and team tags are required to map spend to services and justify rightsizing. |
| Monitoring must evolve | Treat it as a continuous engineering practice; reassess metrics after migrations and architecture changes. |
| IT-Magic engagement path | IT-Magic delivers instrumentation audits, SLI/SLO design, and cost optimization as part of AWS migration engagements. |
The case for monitoring-first migrations
Most migration projects treat monitoring as a post-go-live task. That ordering is backwards. Every migration engagement IT-Magic runs starts with an instrumentation baseline on the source environment, because you cannot prove a migration succeeded without before-and-after performance data. The teams that skip this step spend the first 90 days post-migration chasing incidents they cannot explain.
The pattern that consistently produces the best outcomes: instrument critical user journeys before the migration, carry that telemetry through the cutover, and use the first 30 days on AWS to tighten SLOs against real traffic. Anonymized case evidence from IT-Magic engagements shows measurable reductions in AWS spend and improved throughput after targeted monitoring changes — specifically, fixing autoscaling triggers and rightsizing instances that were invisible without tagged cost data. The monitoring investment is not a cost center. It is the mechanism that makes every other optimization decision defensible.
IT-Magic handles the full monitoring and migration lifecycle
Persistent performance gaps and unattributed cloud spend are the two problems IT-Magic solves most often for teams that have already migrated but never instrumented properly. As an AWS Advanced Tier Partner with 700+ completed projects, IT-Magic takes full ownership of the engagement: instrumentation audit, SLI/SLO design for your critical services, tagging and cost mapping, autoscaling tuning, and runbook automation — with knowledge transfer so your team owns the outcome.
The engagement follows a predictable path: audit in weeks 1–2, pilot on your highest-risk service in weeks 3–6, then rollout and cost and performance optimization across the full environment. Success criteria are defined at scoping, not after the fact. If you are evaluating whether your current AWS environment is instrumented well enough to support growth, start with a migration and monitoring assessment from IT-Magic.
Useful sources and further reading
The sources below are the primary references behind this article’s recommendations.
Start with the official well-architected frameworks before evaluating any vendor tool. Google Cloud, Microsoft Azure, and AWS each publish performance and observability guidance that is more rigorous and less commercially motivated than most vendor documentation.
- Microsoft Azure Well-Architected Framework: Monitoring workload performance — Covers percentile-based latency, health models, and actionable alerting design.
- Google Cloud Architecture Center: Continuously monitor and improve performance — The authoritative source for treating monitoring as a continuous practice tied to architecture reviews.
- Microsoft Azure Cloud Adoption Framework: Monitor — Centralized vs. shared monitoring strategy, telemetry collection, and cost optimization for Azure estates.
- SRE School: What is Cloud Monitoring? — Practical definitions of telemetry pillars, SLI/SLO concepts, and cost trade-offs in monitoring design.
- Cisco: What Is Cloud Monitoring? — Explains unified observability across hybrid and multi-cloud environments.
- Splunk: Cloud Monitoring — Covers MTTD/MTTR reduction through correlated telemetry.
- TechTarget: 16 metrics that matter in cloud performance monitoring — Detailed breakdown of CPU, memory, error rate, and cost metrics for cloud APM.
For implementation details, the OpenTelemetry documentation is the canonical reference for vendor-neutral instrumentation. For cost-visibility playbooks specific to AWS, pair it with the AWS Cost Explorer tagging guide.
FAQ
Why monitor cloud performance instead of waiting for alerts?
Reactive alerting only catches failures after users are already affected. Continuous monitoring detects degradation trends — rising p99 latency, increasing error rates — before they breach SLOs, cutting MTTD from hours to minutes.
What are the most important cloud performance metrics to track?
Request latency (p50/p95/p99), error rate, and throughput are the highest-priority user-facing SLIs. CPU utilization, memory, and queue depth support capacity and cost decisions but should not drive primary alerting.
How does monitoring reduce cloud costs?
Monitoring tracks spend per resource tag and surfaces idle instances, misconfigured autoscaling, and oversized storage tiers. Correlating utilization data with cost data makes rightsizing decisions defensible and measurable.
When should monitoring strategy change after a migration?
Google Cloud recommends reassessing monitoring whenever workloads change significantly. After a migration, re-baseline SLOs against real AWS traffic within the first 30 days and adjust thresholds accordingly.
Can IT-Magic help set up monitoring as part of a migration?
Yes. IT-Magic includes instrumentation audits, SLI/SLO design, and cost-tagging implementation as part of its AWS migration engagements, with success criteria defined at scoping.